COLUMBIA, S.C. — On June 18th, meteorologists across the world "show their stripes" to send a united message on climate change. The viral campaign started in 2019 using a colorful visual that represents the warming trend in recent decades across the planet without using complicated figures and numbers.
The idea for the graphic was created by Ed Hawkins, a climate scientist and professor at the University of Redding in England. Hawkins is known for starting the "show your strips" campaign in June 2019 and for his animation of earth's temperature record used during the opening of the 2016 Rio Olympics.
How to read the stripes
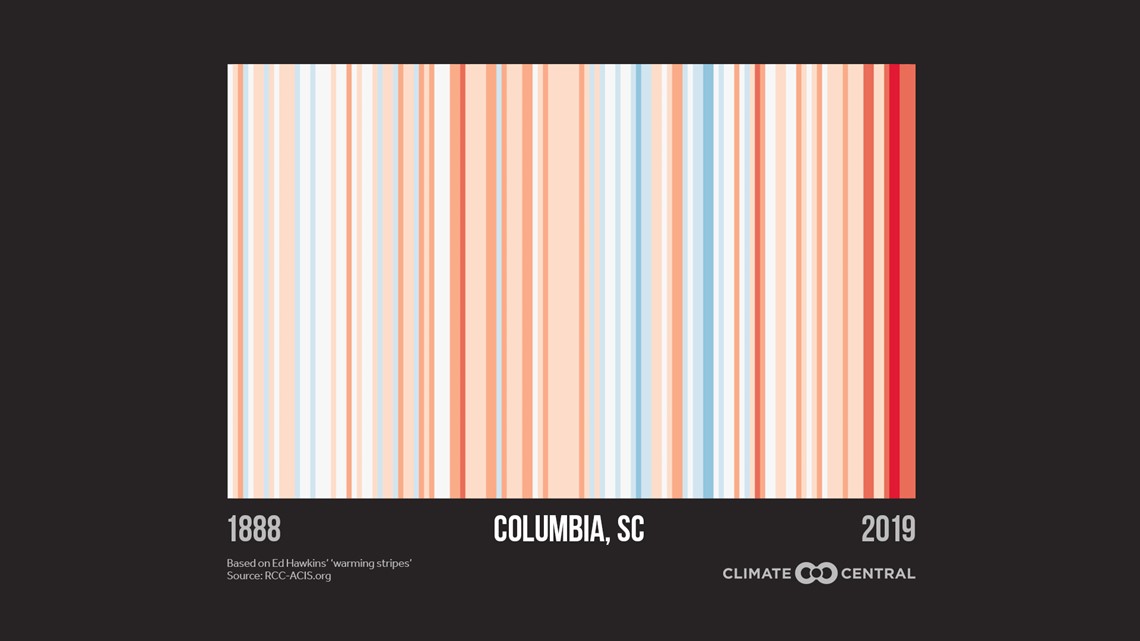
Each stripe represents the average temperature in one year. Red stripes show the year has had warmer than average temperatures and blue stripes represent cooler than average temperatures for a given year. On this global image, all of the recent stripes are red. It's a clear visual that shows the warmest years in recorded history are occurring right now.


The stripes start a conversation, but the actual numbers dig in deeper. The graph below courtesy of NASA shows the earth's average temperature since 1880 and how each year compares to the average temperature from 1951-1980. Earth has recorded temperatures above that average each year since the 1970s. The top 20 warmest years for our planet have occurred since 1997. Last year (2019) was the second warmest year on record for earth and 2016 was the warmest.


Our stripes in the South Carolina Midlands
Our partner, climate central, provided "Stripes" for our area using Columbia's climate data which goes back to 1888. 7 of the 10 warmest years in record for Columbia have occurred since 2010. 2017 was Columbia's warmest year in the record book.


The warming trend in Columbia, SC is pronounced, but it's not as dramatic locally as it is on a global scale. Fluctuation in our local weather create an occasional "dip" in temperature on a trend of warmer years. An isolated pocket of "Cooler than average" or "Near average" temperatures from time to time on a local scale doesn't lessen the impact of the warming trend occurring globally.
This spring hasn't been unusually warm in most of the United States. Our country as a whole has seen "near average" spring temperatures. Here in the southeast, temperatures this spring were slightly below average. It's important to consider that spring in the southeast was also wetter than average, particularly this past May which was the 2nd wettest on record for Columbia, the 3rd wettest for the state as whole. This mild spring comes on the heels of the 6th warmest winter on record for the United States. As of May, this is the 9th warmest year on record for the United States, so it's safe to assume that 2020 will be another hot year compared to the average for the United States and our planet.

